Linetrack Infrastructure Services
Lineside Assets Survey Team
Multiple disconnected systems tracked the same lineside assets under different IDs. Every survey meant hours of manual cross-referencing and reconciliation.
Client name anonymised. Figures are from the engagement, rounded for readability.
Executive summary
From scattered data to connected clarity.
Drag the slider to see what changed.
The problem, in detail.
Pain points uncovered during discovery. Each one costs real time and money.
Which System is Right?
Staff spending 3+ hours daily trying to match assets across SAP, GIS, and internal spreadsheets.
Location Confusion
Assets recorded in different formats (ELR, grid ref, mileage) causing survey teams to visit wrong locations.
Scattered Photos
Thousands of asset photos in folders with inconsistent naming, making evidence retrieval nearly impossible.
Version Control Nightmare
Multiple copies of the "master" tracker, each with different updates, causing data conflicts.
How we fixed it.
A unified ID crosswalk system linking all asset identifiers, with a single tracker replacing multiple spreadsheets and automated photo management.
Quick Wins
Immediate improvements with minimal disruption
- Standardised naming convention
- Single source tracker created
- ID crosswalk mapping started
Foundation
Building the core data infrastructure
- Complete ID crosswalk
- Location format standardisation
- Historical data migration
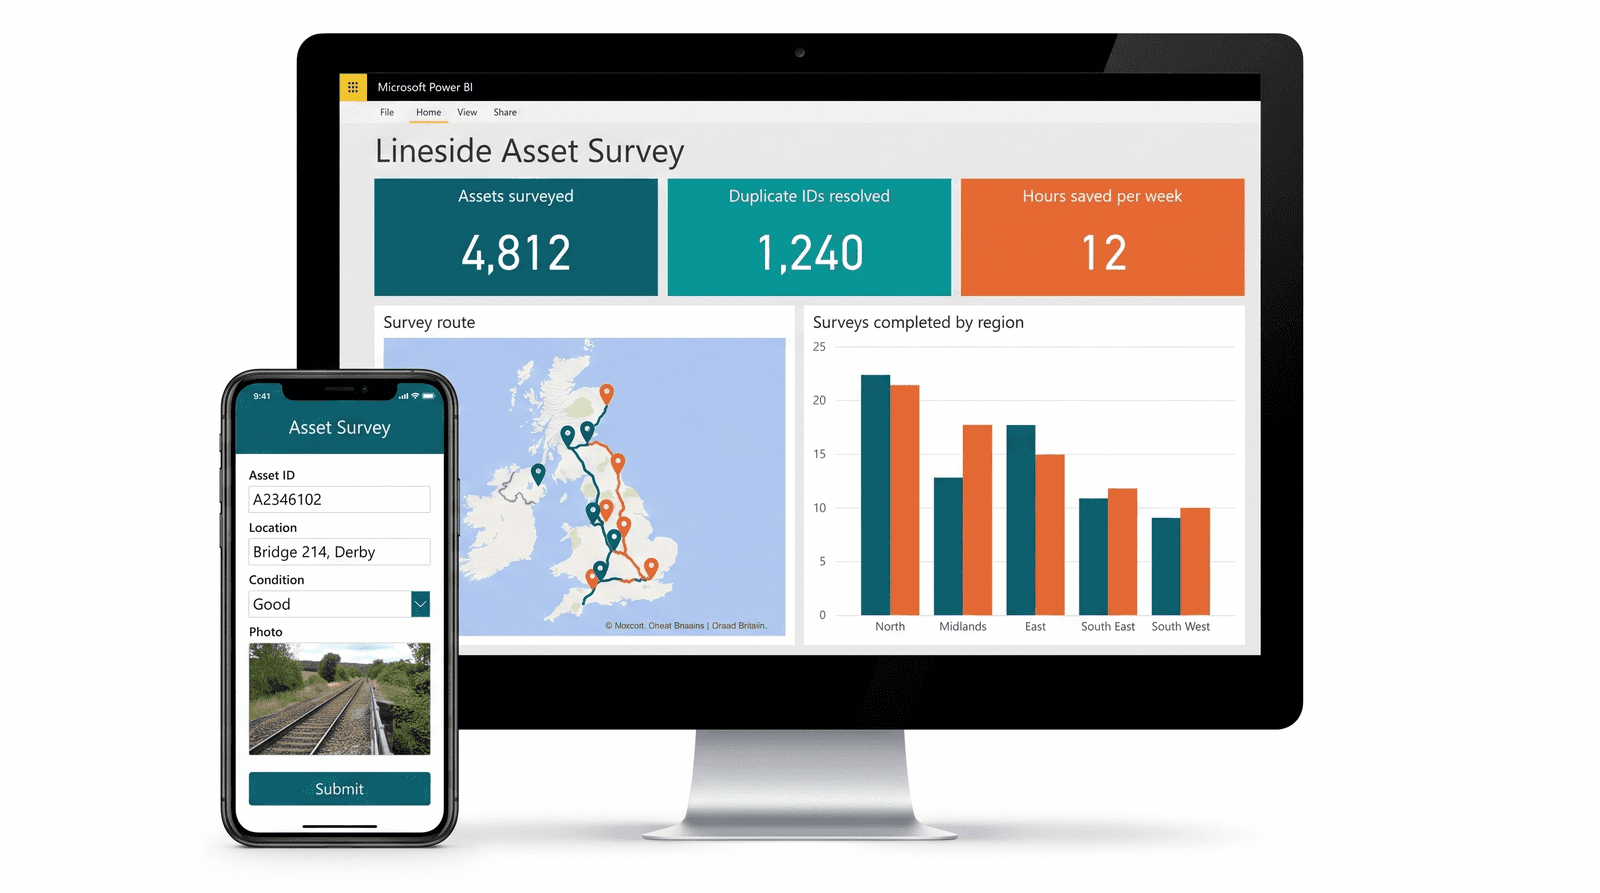
Mobile Capture
Field team tools and workflows
- Mobile data capture app
- Auto-linked photo uploads
- Real-time sync to central tracker
Automation
Reducing manual work with smart automation
- Automated reconciliation reports
- Exception alerts
- Dashboard rollout
Five dimensions. One picture.
How the organisation scored across five key areas of data maturity, before and after.
The measurable impact.
Numbers from the engagement. Your results will depend on scope and starting point.
Real feedback from real people.
“I spend more time finding information than actually scheduling surveys. It's frustrating.”
“Every system shows different data for the same asset. Which one do I trust?”
Ready to fix your data?
Most businesses carry hidden costs from scattered data. Tell us where it hurts and we'll map the system that fixes it.